Travel time in Major League Baseball
What can we learn if we look at the time MLB teams will travel over the course of the 2018 season? I’m not trying to predict anything with this data, just trying to play around with visualizing the data in interesting ways. Right now I have the following files under data.csv:
{TEAM}.csv- a list of games that will be played by a team. The relevant pieces of data are as follows:START DATESUBJECT- a game description (eg. “Pirates at Mariners”)LOCATION- where the game is being played (eg. “Safeco Field”)- all other data is remnants of
mlb.compoorly converting from iCal invites to CSV
distance matrix.csv- a distance matrix in miles to/from every ballpark in the MLB
So far I have generated a these graphs:
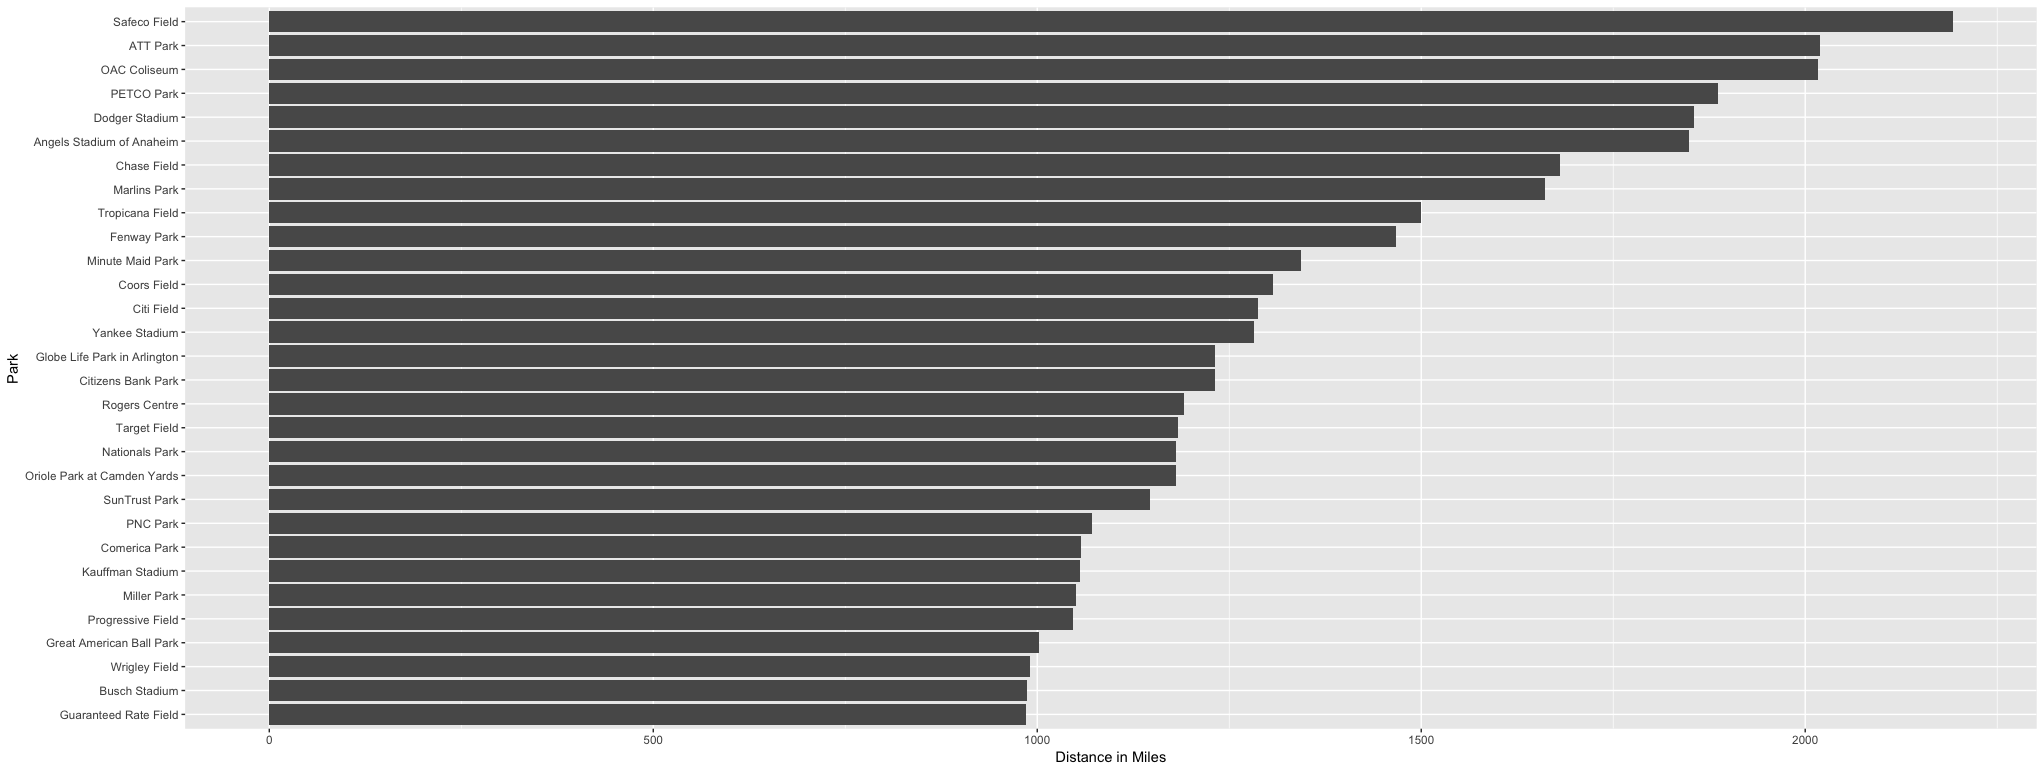
Mean distance to all other parks.
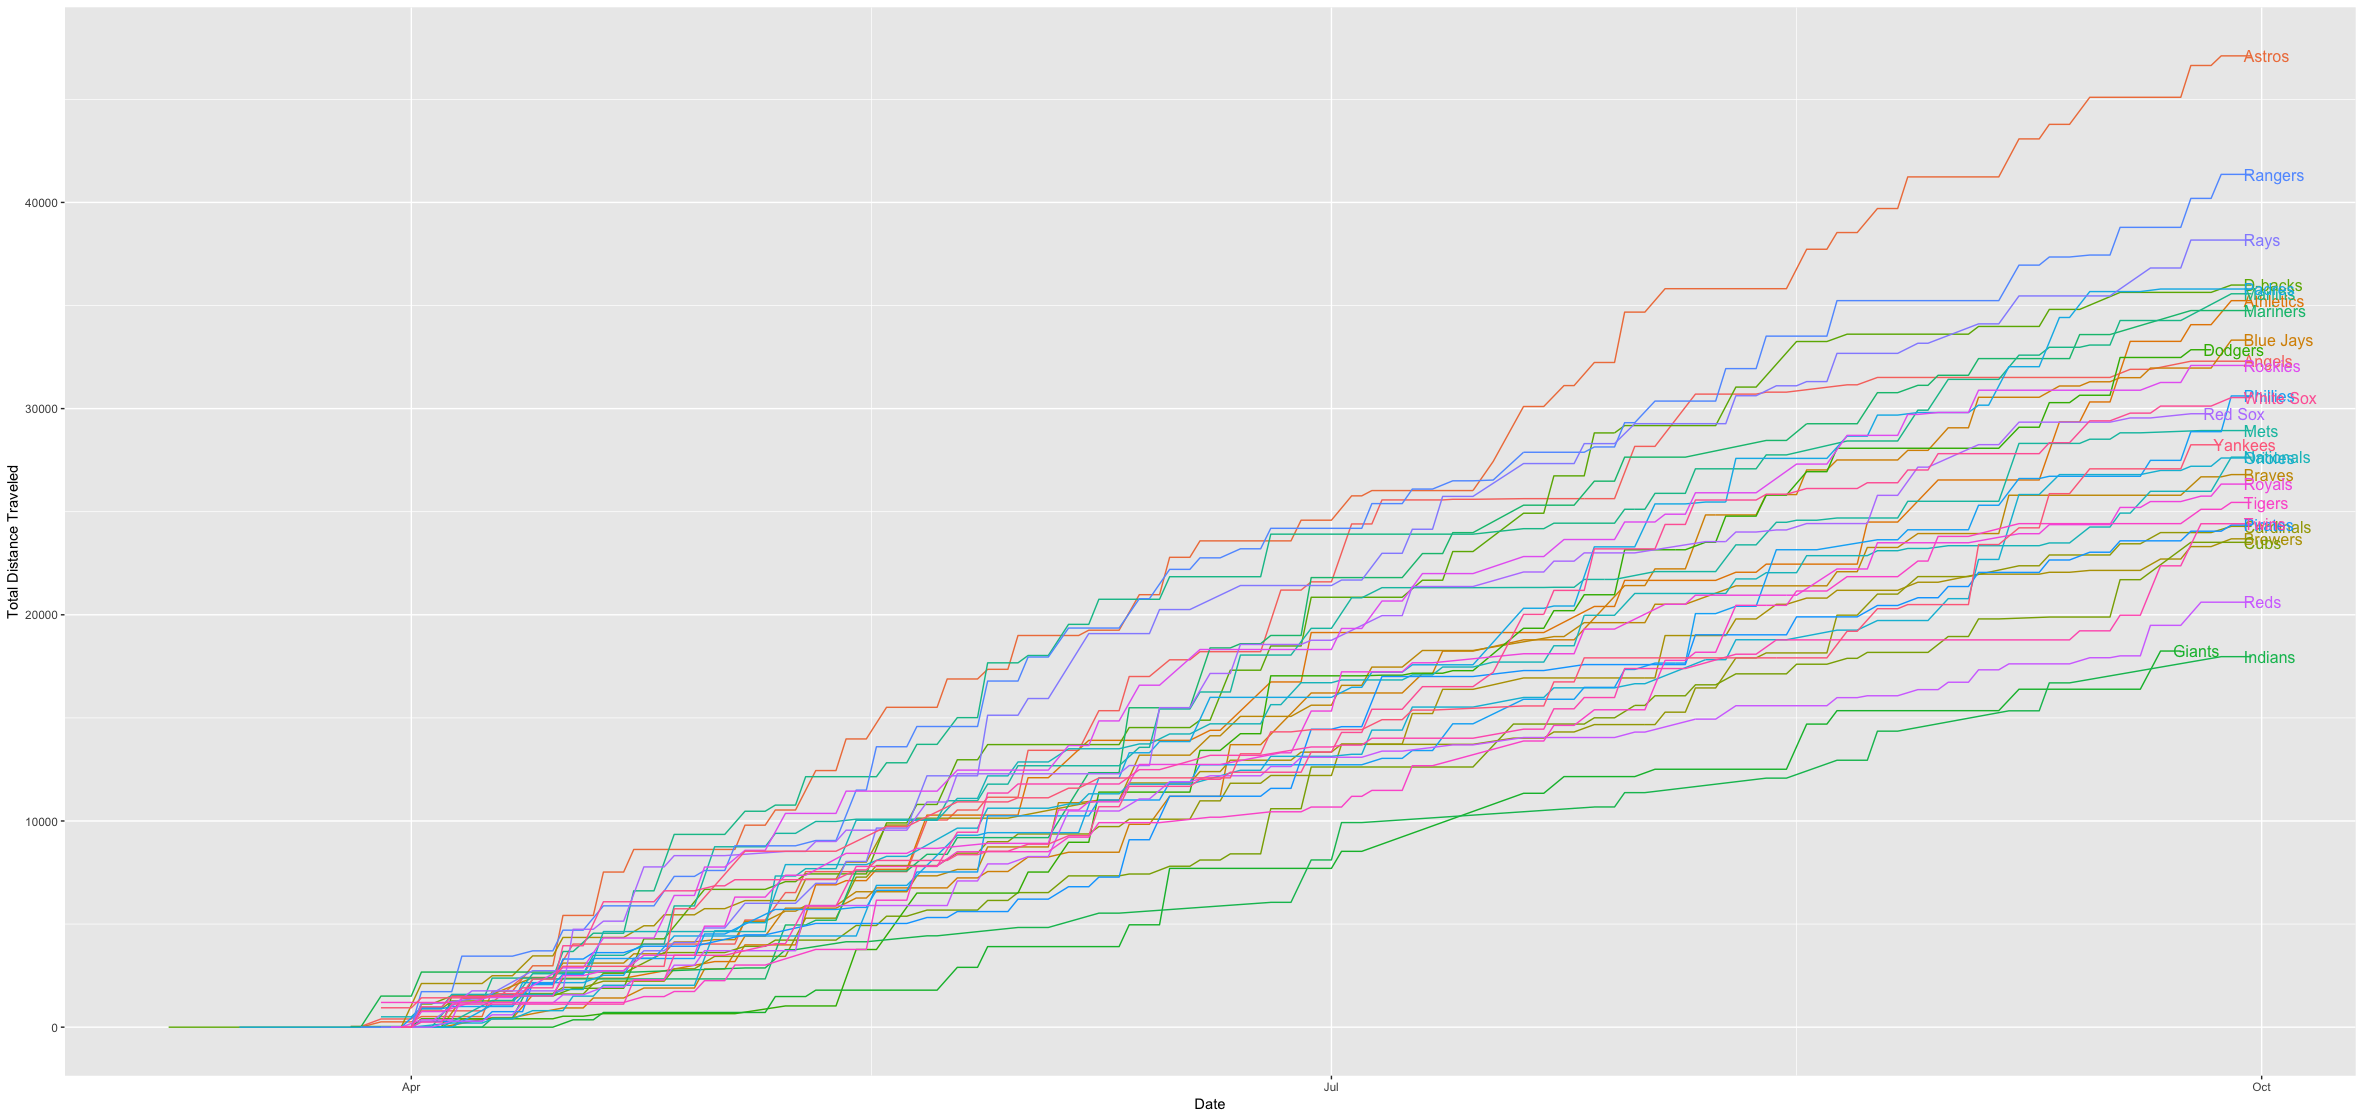
Cumulative distance traveled by team
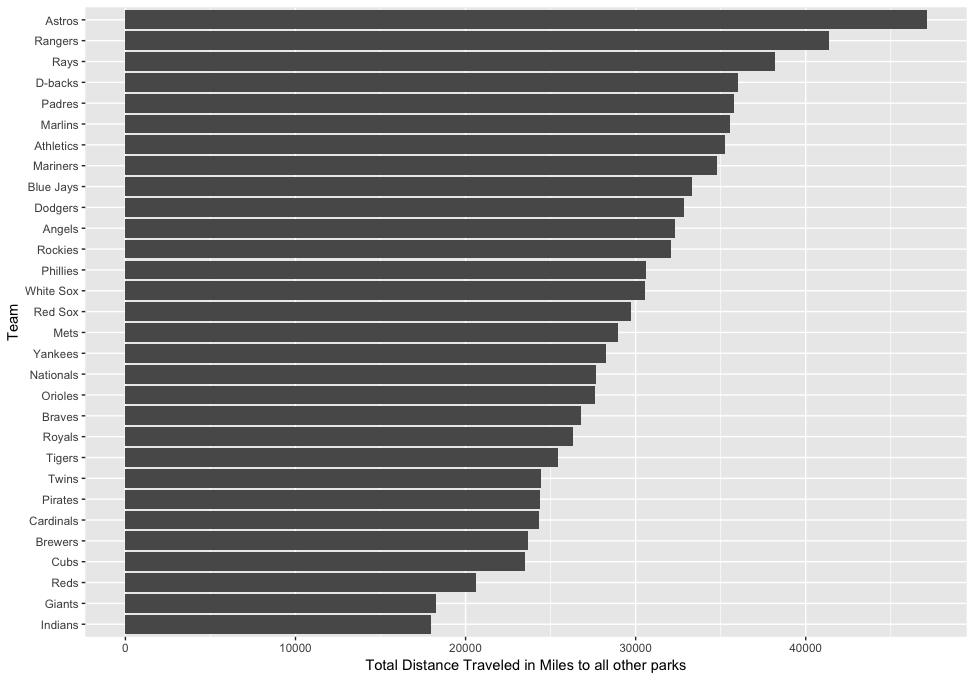
Total distance traveled by team
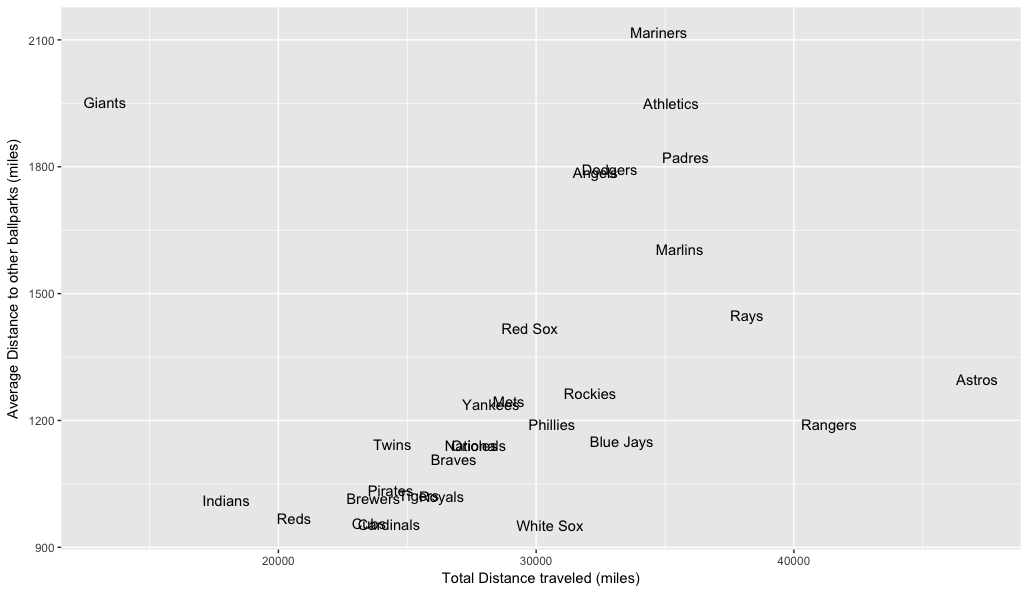
Total distance vs avg distance
Sources of Data
- Schedules of games - downloaded directly from
http://www.ticketing-client.com/ticketing-client/csv/EventTicketPromotionPrice.tiksrv\?team_id\={TEAM ID} - Distance matrix of parks - from
https://bitbucket.org/trhdata/mlb-stadiums/src